sim_flight_kalman.py
Run a synthetic rocket flight through a Python mirror of the AURORA Kalman filter and plot the result.
What it does
The script is a 1:1 Python port of the firmware filter pipeline. The two mirrored components are:
The two-state (altitude, velocity) constant-acceleration Kalman filter from
aurora/lib/filter/kalman.c(Filter,filter_init,filter_predict,filter_update,filter_detect_apogee).The body-frame gravity tracker from
aurora/lib/sensor/attitude.c(Attitude,attitude_init,attitude_calibrate_sample,attitude_calibrate_finish,attitude_update,attitude_is_calibrated).
Function names, struct layout, return semantics (0 = OK, 1 =
gated/apogee, negative errno on error) and arithmetic order all track
the C, so any tuning change made in Kconfig or in the C sources can be
reproduced in Python by updating the mirrored constants at the top of
the file.
The script generates its own synthetic data:
A pressure signal from the ISA barometric formula.
A body-frame IMU stream (accel + gyro) with a slow pitch-over after apogee, so the gravity tracker actually has to do something.
MS5607-flavoured Gaussian noise on top of the pressure stream.
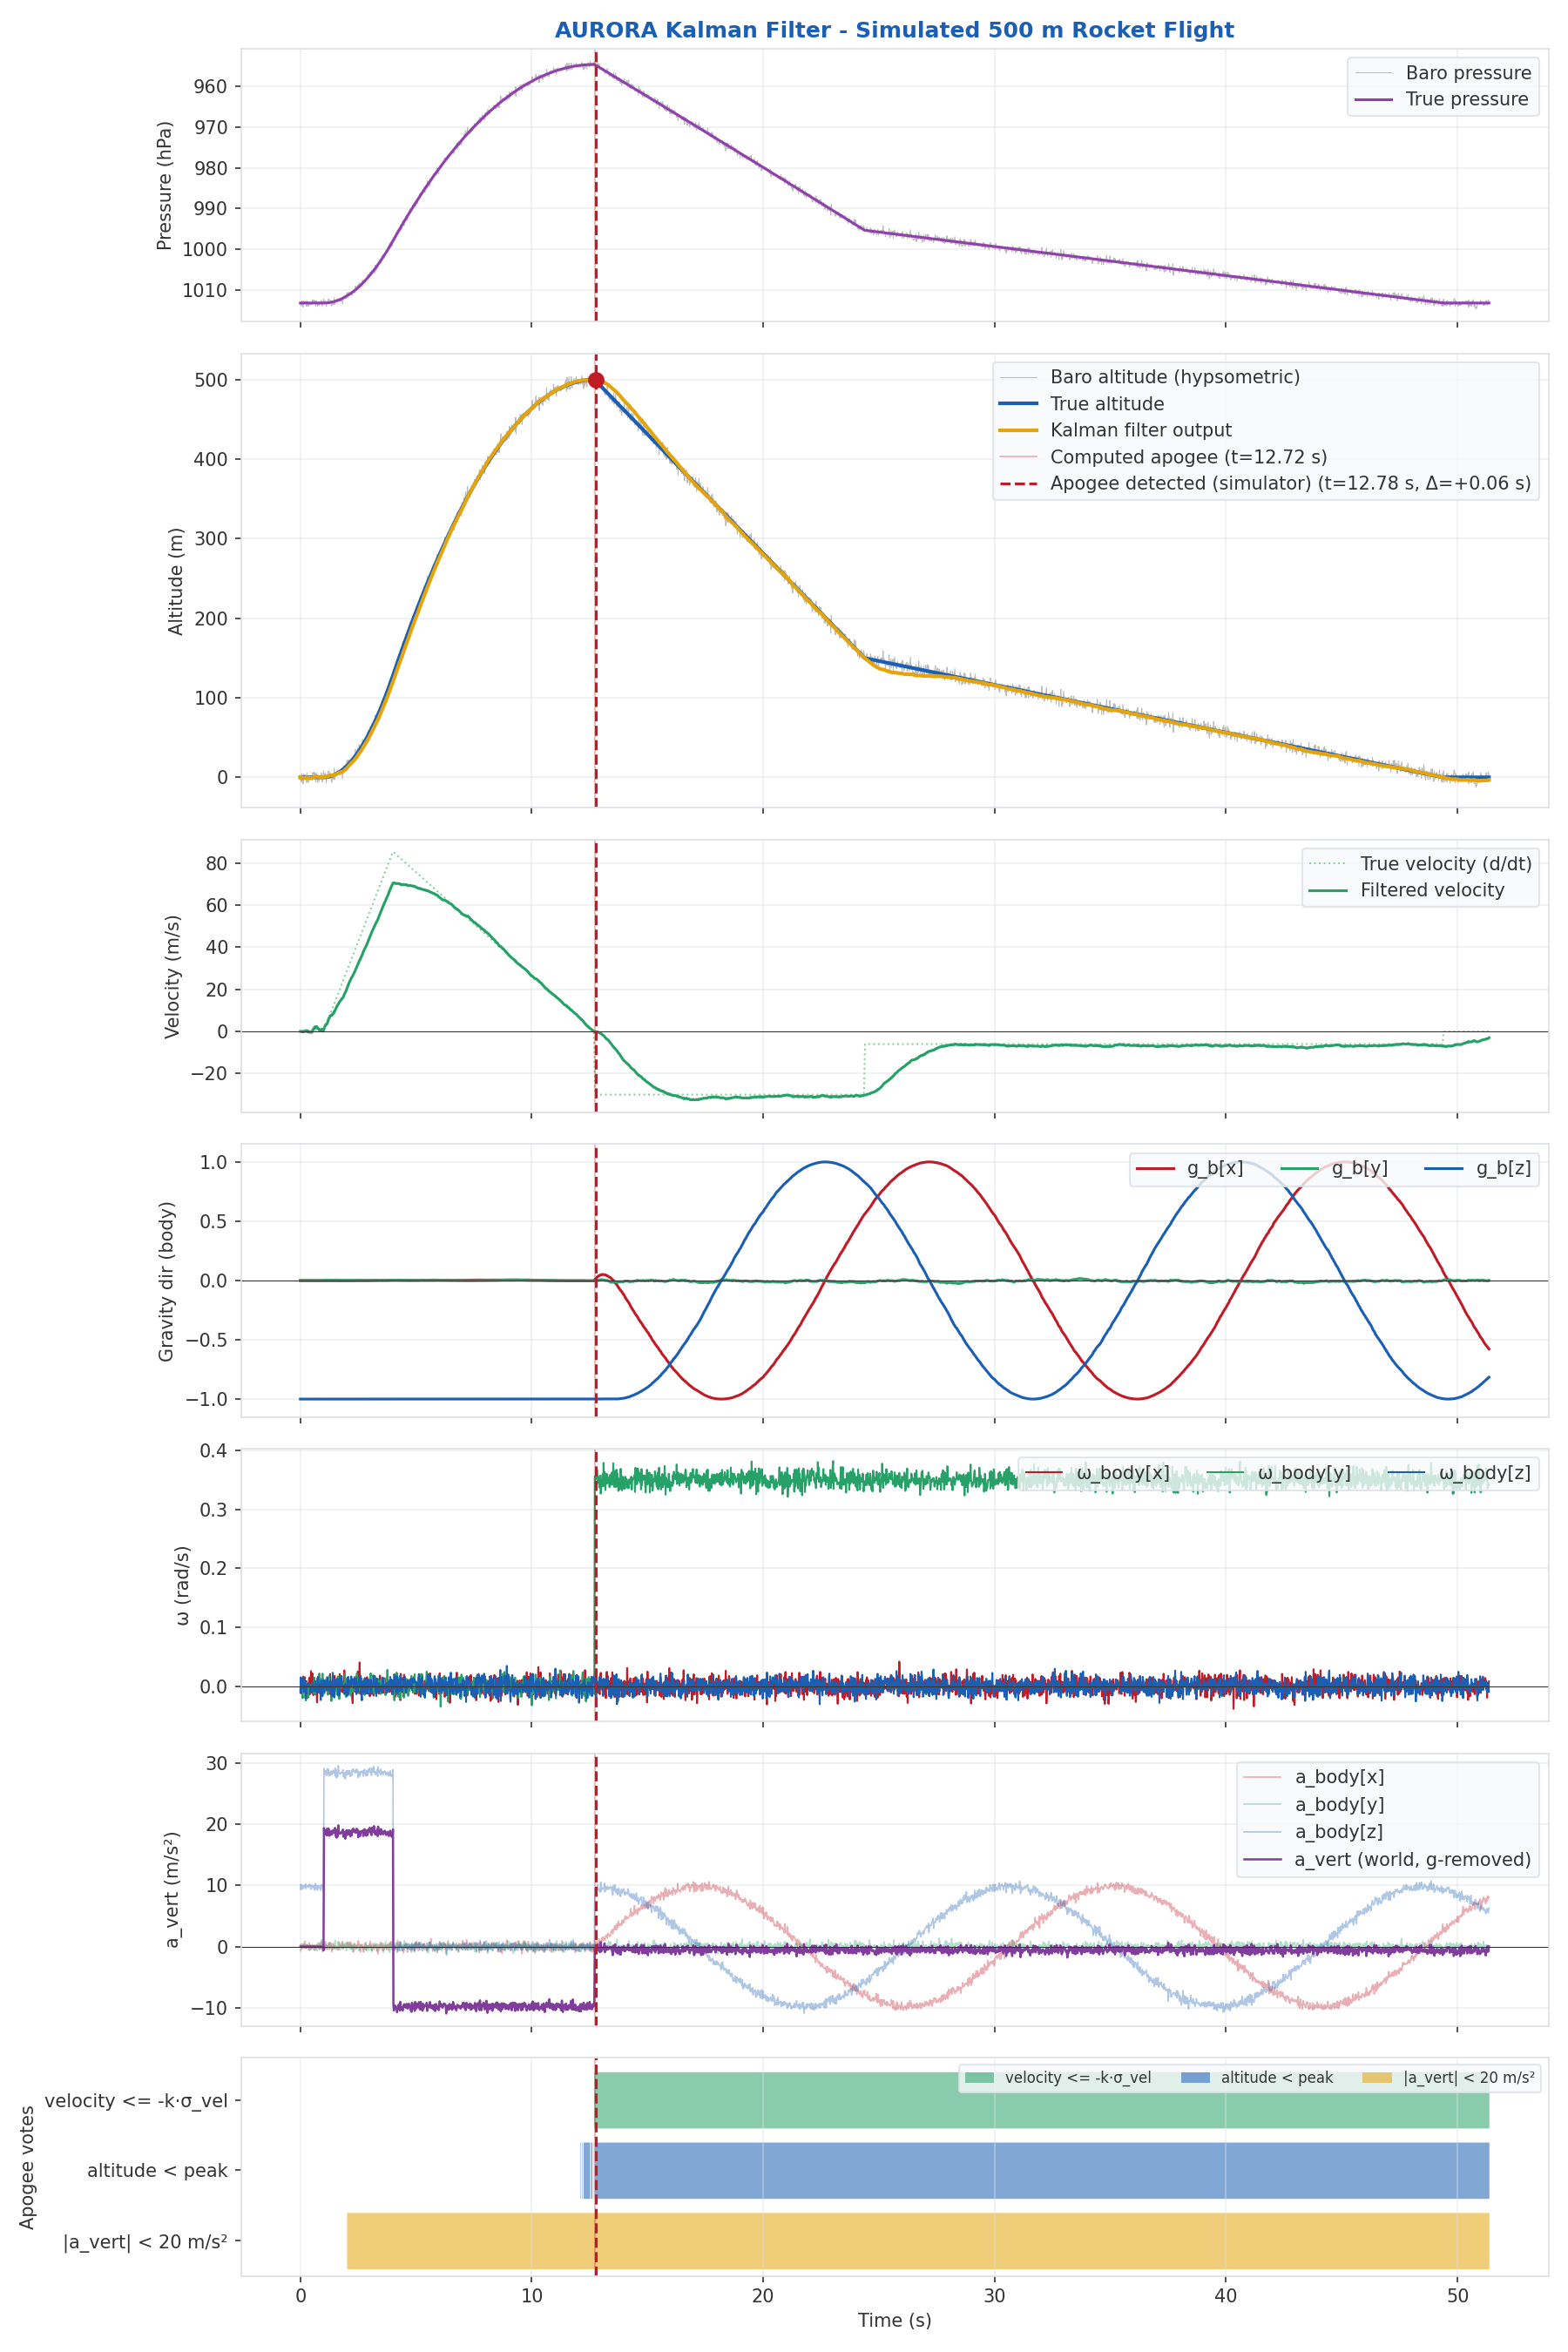
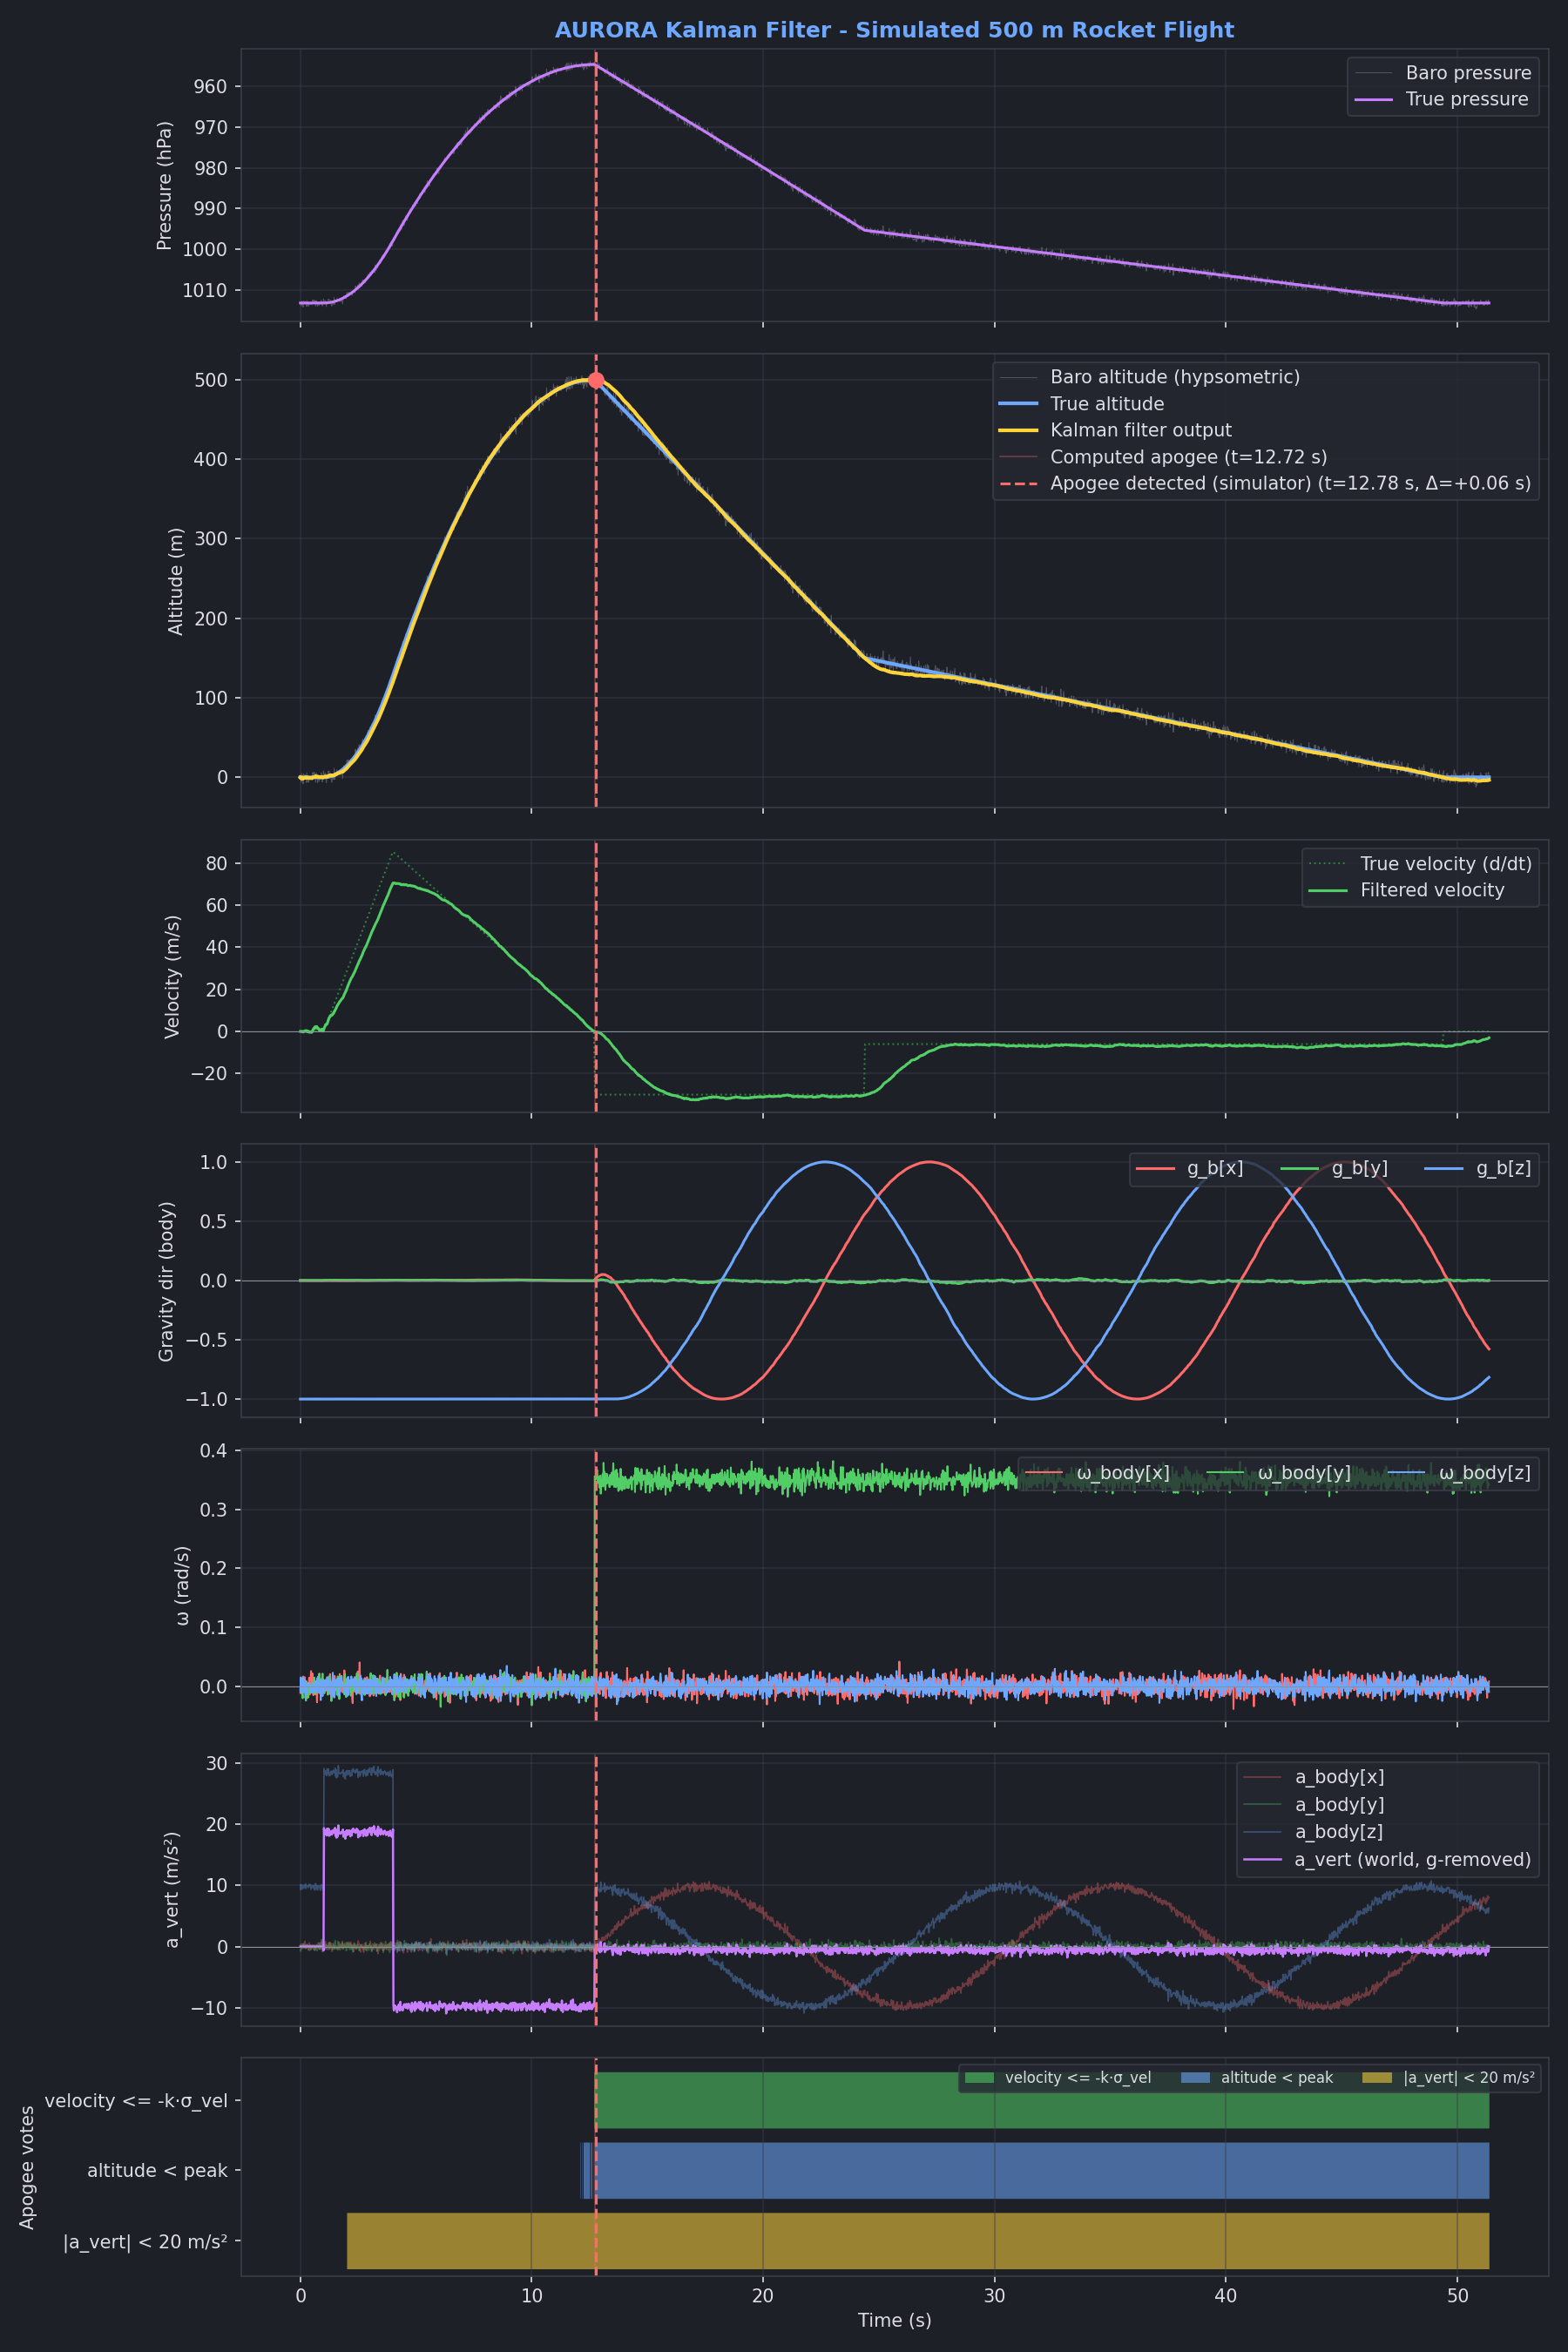
These streams are fed through the filter mirrors at 50 Hz and the
results are handed to plot_flight_data.py,
which produces the seven-panel plot shown below.
Note
Plotting is delegated to plot_flight_data — sim_flight_kalman.py no
longer plots anything itself. To plot recorded telemetry from a flight
log, use plot_flight_data.py --flight DIR directly.
Usage
python3 tools/sim_flight_kalman.py [--theme {light,dark,both}]
                                   [--show] [--title TITLE]
--theme {light,dark,both}— render plots matching the Furo Sphinx docs theme (defaultboth).--show— open the plots in an interactive matplotlib window in addition to writing them to disk.--title TITLE— override the plot title.
Filter and attitude tuning is not exposed on the CLI on purpose: the
constants at the top of the script (CONFIG_FILTER_*,
CONFIG_IMU_UP_AXIS_*) are the same Kconfig defaults the firmware uses,
so a default run is directly comparable to a default flight build. To
sweep tuning, edit those constants or use
sweep_apogee.py.
The output file is flight_simulation.png (or _light / _dark
suffixed when --theme both is used). A typical run looks like this:
Ground ref pressure: 101326 Pa (1013.3 hPa)
True apogee:         500.0 m (t = 12.71 s)
Filter apogee:       499.7 m (t = 12.78 s)
Attitude g_mag:      9.794 m/s²
Gated baro updates:  0
[light] Plot saved to flight_simulation.png
Reuse from other scripts
The filter and attitude mirrors are exposed as plain module-level functions so they can be driven from any other Python tool that wants to replay or sweep them:
Filter,filter_init,filter_predict,filter_update,filter_detect_apogee,filter_votesAttitude,attitude_init,attitude_calibrate_sample,attitude_calibrate_finish,attitude_update,attitude_is_calibratedsimulate_flight(...)— generate the synthetic trajectory used by the default run.
Helpers for loading recorded telemetry (parse_influx,
parse_state_audit, segment_flights, etc.) now live in
plot_flight_data.py.
Requirements
Python 3.10+
numpy,matplotlib